Executive risk is heavily controlled for most of a typical day: residence, office, hotel, aircraft, meeting room, secured venue.
Road movement is different. The executive is suddenly exposed to speed, kinetic energy, other drivers, intersections, weather, road design, distraction, and decisions made by hundreds of strangers. The exposure may only occupy one or two hours. The consequence potential rises dramatically during that period.
What the Data Shows
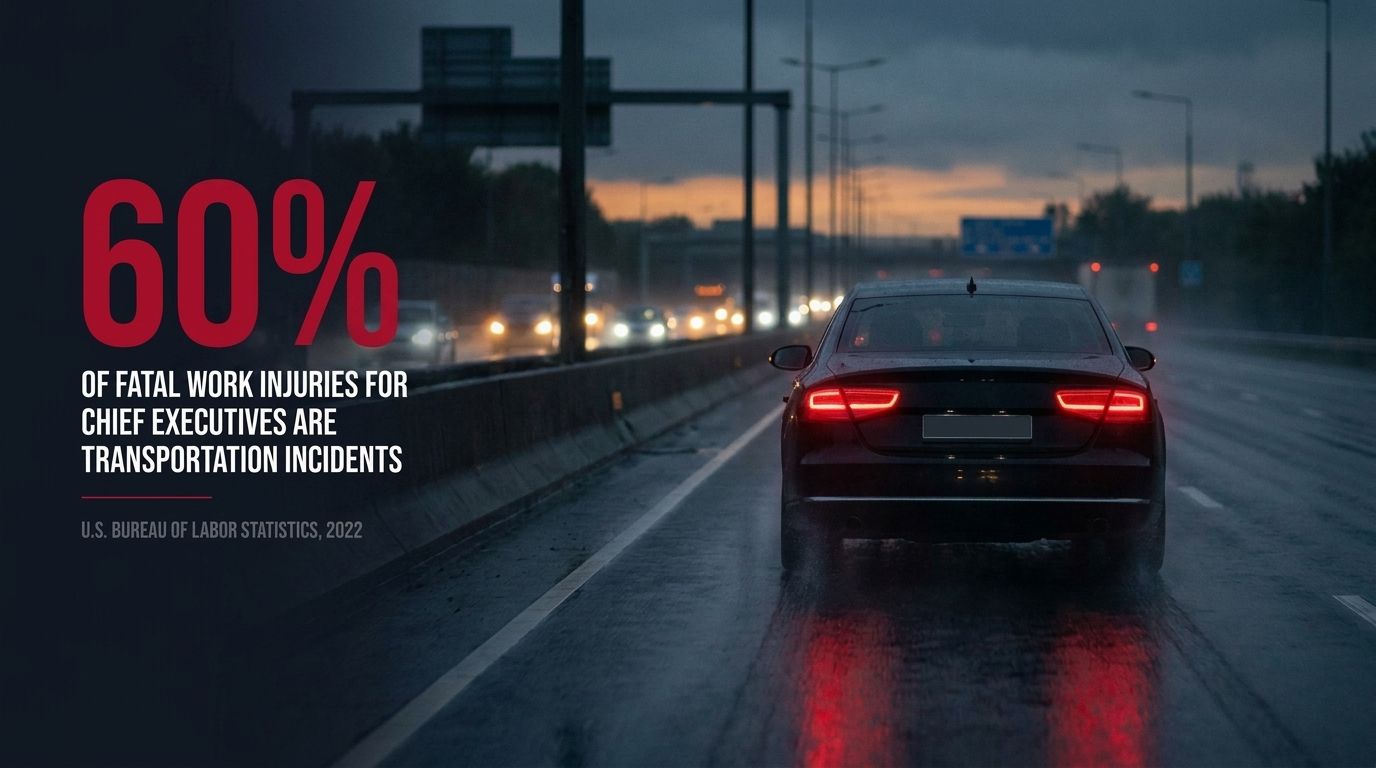
There is executive-specific data behind that statement. In the Bureau of Labor Statistics data for 2022, transportation incidents accounted for 60% of the fatal occupational injuries recorded for chief executives. For the broader category of top executives, it was exactly half. In 2021, transportation was again the largest category recorded for chief executives.
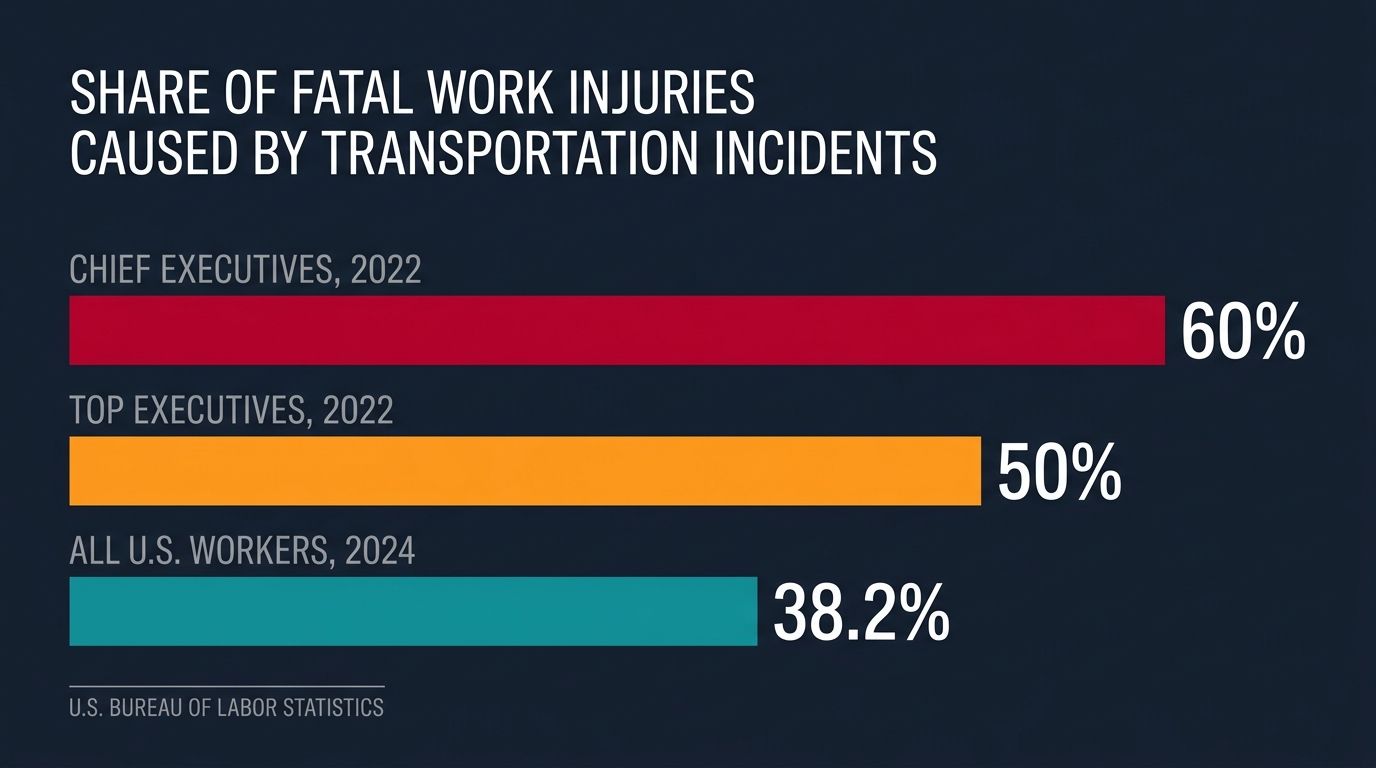
The broader statistics reinforce it. In 2024, transportation incidents were the largest category of occupational fatalities in the United States at 38.2% of all fatal work injuries. That is more than two and a half times the share taken by violent acts. Outside the occupational dataset, NHTSA recorded 39,254 U.S. traffic deaths in 2024. That is a fatality rate of 1.19 deaths per 100 million vehicle miles traveled.
An executive may spend ten hours inside controlled environments and only ninety minutes moving between them. Risk is not distributed evenly across those eleven and a half hours. Once the vehicle moves, the environment changes. Speed creates energy. Distance disappears quickly. Other road users introduce variables nobody can control. And the driver becomes responsible for managing all of it in real time.
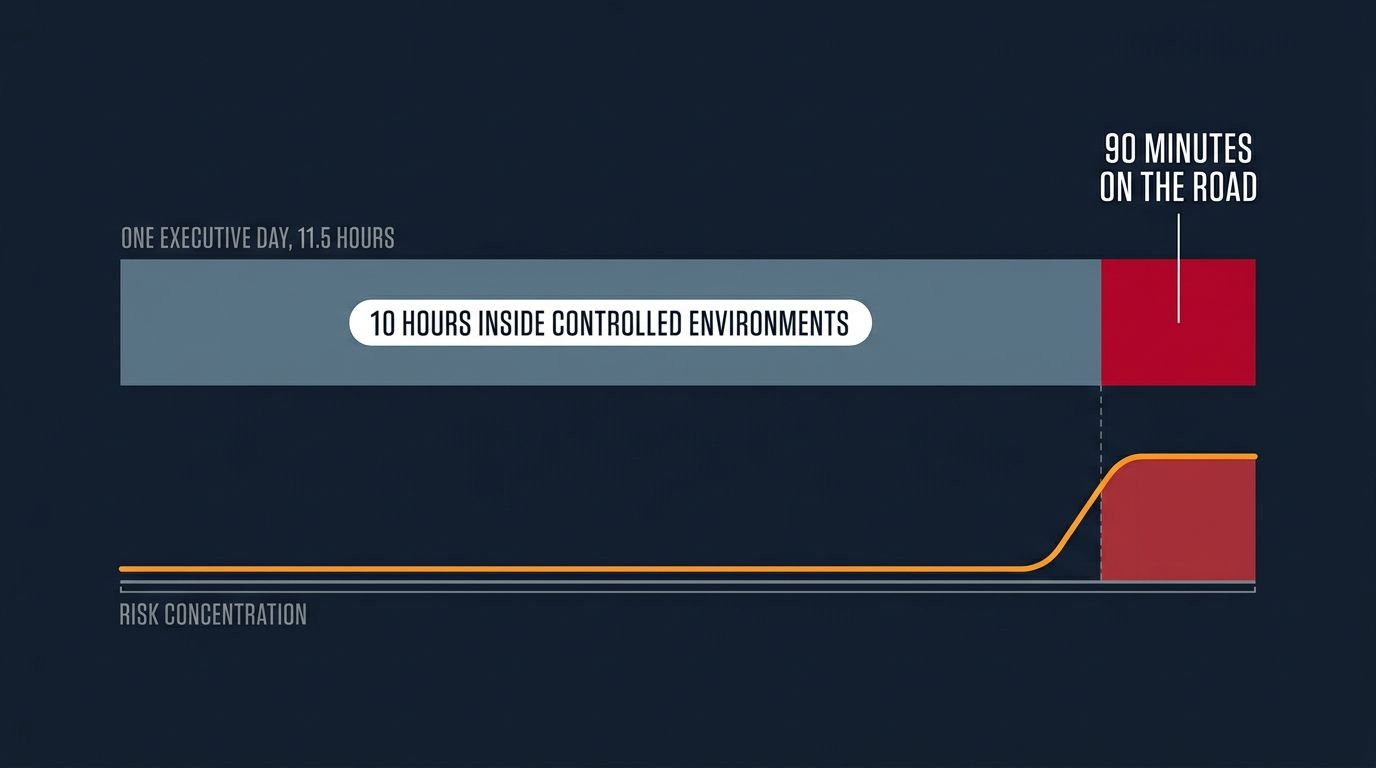
We spend enormous resources protecting executives at destinations. Statistically, one of the highest concentrations of ordinary physical risk exists between those destinations.
The Claim Worth Making
Saying driving is statistically the most dangerous moment of every executive's day overstates what the datasets prove. The stronger and harder-to-attack statement:
For an executive, road movement can represent the highest concentration of acute physical risk in an otherwise controlled day.
The place with the highest concentration of risk is also the place where the organization has the least control over the environment.
The Only Variable Left
Since the environment cannot be controlled, the option that remains is improving the person operating inside it.
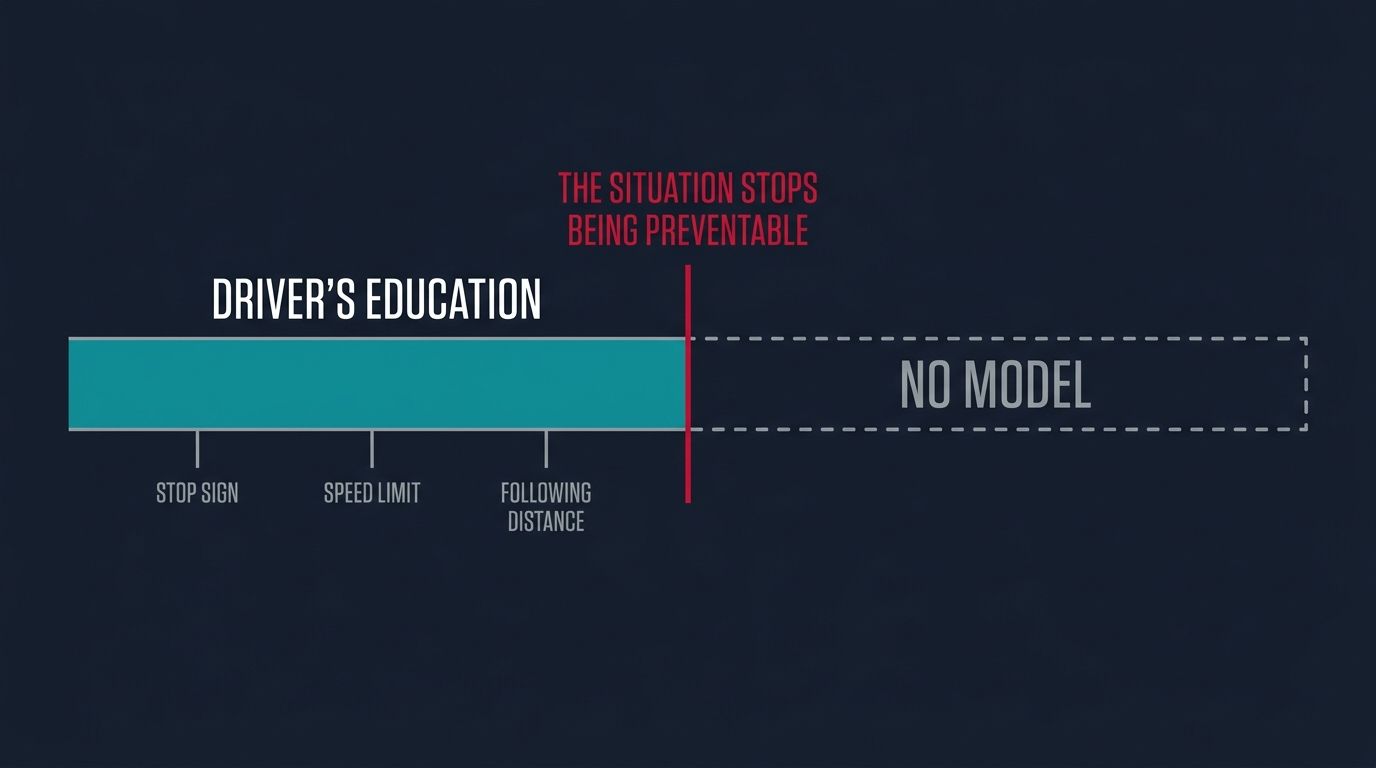
Most executives drive themselves. Everything they were ever taught about driving belongs to prevention: the stop sign, the speed limit, the following distance. Prevention works until the moment the situation stops being preventable. For everything after that moment, driver's education left the brain without a model.
How the Model Gets Built
Nobody learns the piano by watching videos, and nobody builds a skill by reading about it. A driver who has never felt a loss of control has no mental model for one. The brain cannot recognize what it has no model for. When the situation arrives anyway, recognition comes late or not at all, and a driver with no answer freezes.
The model is built one way, by experiencing it. Feeling the moment grip leaves. Learning what time and distance actually allow. Braking and steering under real stress, until the response exists before it is needed. That is training, and it is the same training a security driver gets.
An executive can be trained in the same skills as a security driver. The result is the same: a lower probability of freezing when the moment comes.
Not every key executive in the company can get a driver. So, what stops you from training them the way you would a security driver, giving them the right tools to succeed and protecting the talent the company has already invested in?
Sources
U.S. Bureau of Labor Statistics. Census of Fatal Occupational Injuries, Table A-5, fatal occupational injuries by occupation and event or exposure, all United States, 2022 and 2021.
U.S. Bureau of Labor Statistics. National Census of Fatal Occupational Injuries in 2024, USDL-26-0230, February 2026.
National Highway Traffic Safety Administration, National Center for Statistics and Analysis. Overview of Motor Vehicle Traffic Crashes in 2024, Traffic Safety Facts Research Note.